TL;DR
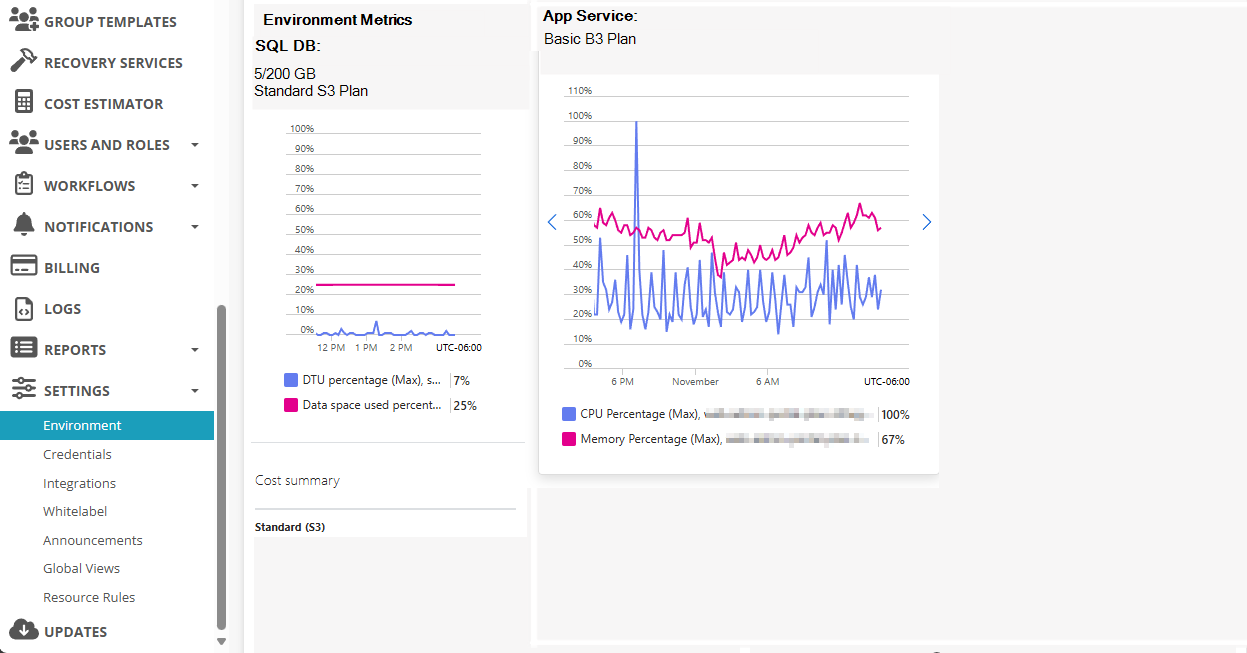
It'd be nice to see the current App Service Plan Size, App Service Metrics (CPU and Memory), SQL DB DTU/Service Plan, and SQL DB Metrics (CPU/DTU/vCores) directly within NMM.
Would this information be useful to anyone?
(Rough Rendering)
As your AVD practice grows, so does the performance requirements (and potentially the cost (Default Deployment Resources and Costs – Nerdio Help Center)).
I've had a few partners have issues with NMM being slow.
When this happens, they submit a ticket to support, support has them check the performance metrics for the SQL DB and the App Service Plan that NMM uses.
Based on that information, they make recommendations like "Setup a NAT Gateway for your NMM instance", "Increase your DTUs on the SQL Database", or "Upgrade your App Service Plan".
It would be great to be able to display a snapshot of the Metrics (see screenshot above) with the current plans.
Then, have a refresh button to get the latest information or a hyperlink to go to the different parts of the Azure Portal to view the information in more details.
Thoughts?
Comments (2 comments)